How to Build a DIY Weather Station Using Raspberry Pi
10 min read Learn how to build a robust DIY weather station using Raspberry Pi to monitor local weather conditions accurately. (0 Reviews)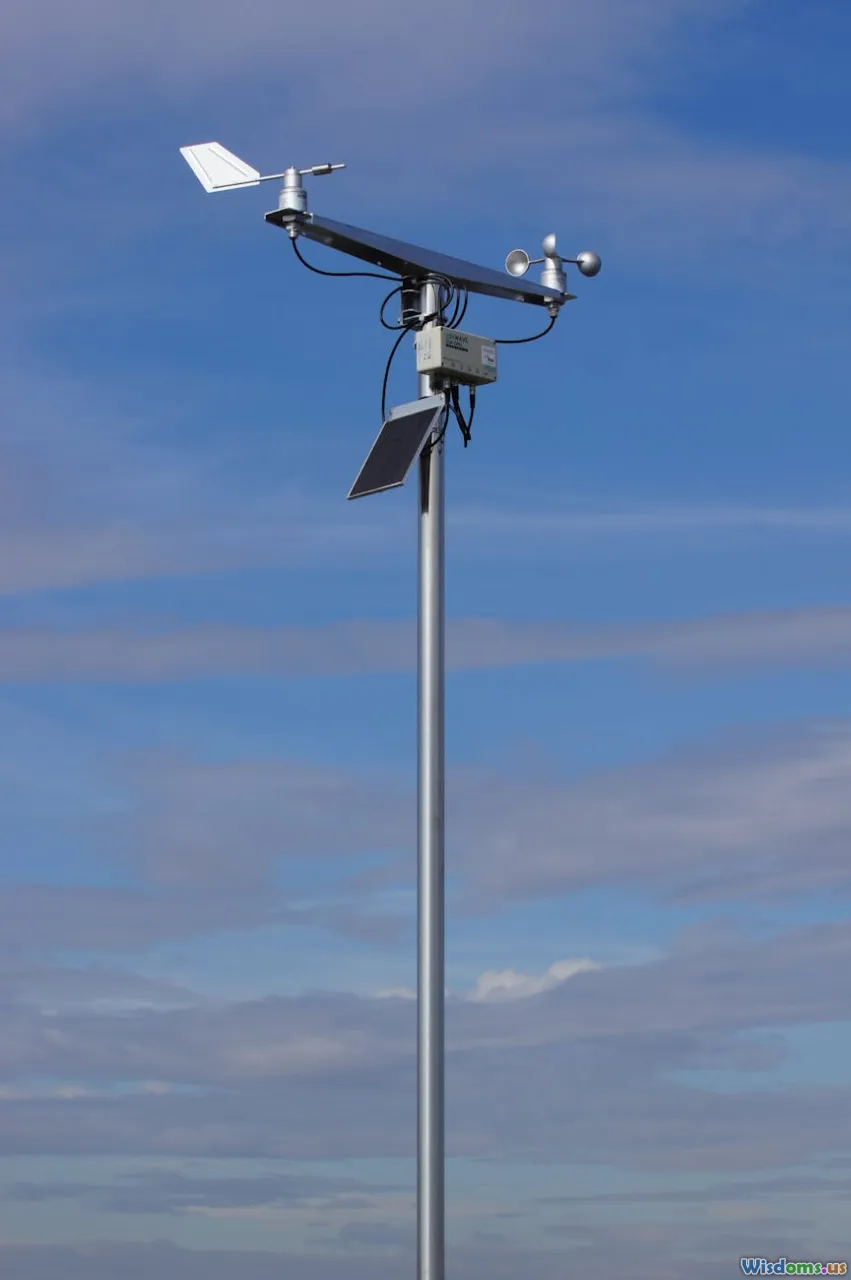
How to Build a DIY Weather Station Using Raspberry Pi
Weather affects everything from daily plans to scientific research. Imagine having your own on-demand weather station right in your backyard—monitoring temperature, humidity, pressure, and more with real-time data feeding directly to your devices. This isn’t just a dream; with a Raspberry Pi and some sensors, you can build a reliable, customizable weather station that offers both hands-on experience and practical benefits.
Introduction
The Raspberry Pi, a compact, affordable minicomputer, has revolutionized DIY projects. When paired with weather sensors, it transforms into a precise environmental monitor capable of gathering various atmospheric data points. This tutorial explores the step-by-step process of creating a weather station suited for hobbyists, educators, or anyone passionate about meteorology and technology.
We'll delve into component selection, circuit assembly, software installation, data collection, and visualization. Along the way, expect insights drawn from real hobbyists’ experiences and tips to make your weather station not only functional but also scalable.
Essential Components and Equipment
To build an effective Raspberry Pi weather station, you need a blend of hardware and software. Here’s a list of essentials:
- Raspberry Pi (Model 3 or newer recommended): Provides the processing power. Model 4 offers faster performance and Wi-Fi capability.
- MicroSD Card (16GB+): For the OS and data storage.
- DHT22 Sensor: Measures temperature and humidity with good accuracy.
- BMP280 Sensor: Monitors atmospheric pressure.
- Anemometer: To measure wind speed (optional, more advanced).
- Rain Gauge: For precipitation data (optional).
- Jumper Wires and Breadboard: For connecting sensors to Raspberry Pi GPIO pins.
- Power Supply: Reliable USB power supply and cable.
- Enclosure: Weatherproof housing to protect electronics.
Example: Peter Gregory, an environmental enthusiast, shared on Instructables that using a simple DHT22 and BMP280 sensor combo yielded reliable data on his DIY station, sufficient for his gardening and local weather reports.
Step 1: Setting Up the Raspberry Pi
Begin by installing the Raspberry Pi OS. Download the latest Raspberry Pi OS via the official website and flash it onto your microSD card using tools like Balena Etcher.
Once set up:
- Enable SSH and I2C interfaces: This allows remote access and sensor communication.
- Update your system: Run
sudo apt-get updateandsudo apt-get upgradeto ensure you have the latest packages.
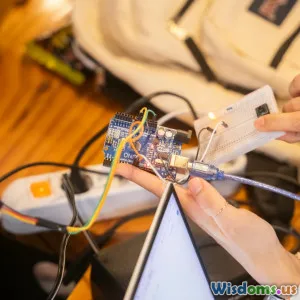
Step 2: Connecting the Sensors
Temperature and Humidity Sensor (DHT22)
- Connect the sensor’s VCC pin to 3.3V on the Pi.
- Connect GND to ground.
- Data pin connects to one of the GPIO pins (e.g., GPIO4).
Atmospheric Pressure Sensor (BMP280)
This sensor typically uses the I2C protocol.
- Connect VCC to 3.3V.
- Connect GND to ground.
- Connect SDA and SCL to respective I2C pins (GPIO2 and GPIO3).
Pro tip: Use a breadboard and jumper wires for neat, reconfigurable connections.
Step 3: Installing Software and Libraries
You need to read data from sensors and store or visualize it.
Install Python libraries:
sudo pip3 install Adafruit_DHT
sudo pip3 install smbus2
sudo pip3 install matplotlib
sudo apt-get install python3-pandas
These libraries handle sensor readings (Adafruit_DHT, smbus2) and data manipulation/visualization (matplotlib, pandas).
Step 4: Writing the Sensor Data Script
Create a Python script to collect data periodically.
import Adafruit_DHT
import smbus2
import time
from datetime import datetime
import pandas as pd
import matplotlib.pyplot as plt

DHT_SENSOR = Adafruit_DHT.DHT22
DHT_PIN = 4

# Address for BMP280
BMP280_ADDR = 0x76

# Initialize I2C bus
bus = smbus2.SMBus(1)

# Function to read BMP280
# (Implement according to sensor datasheet)

def read_pressure():
    # Example placeholder function
    # Actual implementation will decode sensor registers
    return 1013.25

# Data storage lists
timestamps = []
temperatures = []
humidities = []
pressures = []

try:
    while True:
        humidity, temperature = Adafruit_DHT.read_retry(DHT_SENSOR, DHT_PIN)
        pressure = read_pressure()
        if humidity is not None and temperature is not None:
            now = datetime.now()
            print(f"{now} Temp={temperature:.1f}C Humidity={humidity:.1f}% Pressure={pressure}hPa")

            timestamps.append(now)
            temperatures.append(temperature)
            humidities.append(humidity)
            pressures.append(pressure)

            time.sleep(60)  # Wait one minute between readings
        else:
            print("Sensor failure. Retrying...")
            time.sleep(10)
except KeyboardInterrupt:
    # Save data
    df = pd.DataFrame({
        'DateTime': timestamps,
        'Temperature_C': temperatures,
        'Humidity_%': humidities,
        'Pressure_hPa': pressures
    })
    df.to_csv('weather_data.csv', index=False)

    # Plot data
    plt.figure(figsize=(10,6))
    plt.subplot(3, 1, 1)
    plt.plot(df['DateTime'], df['Temperature_C'], label='Temperature (°C)')
    plt.legend()

    plt.subplot(3, 1, 2)
    plt.plot(df['DateTime'], df['Humidity_%'], label='Humidity (%)', color='green')
    plt.legend()

    plt.subplot(3, 1, 3)
    plt.plot(df['DateTime'], df['Pressure_hPa'], label='Pressure (hPa)', color='red')
    plt.legend()

    plt.tight_layout()
    plt.show()
Adjust read_pressure() to the correct BMP280 register reading sequences; many libraries are available to interface easily.
Step 5: Protecting Your Weather Station
Use a weatherproof enclosure with openings that ensure accurate readings without exposing your electronics to rain or dust. For example:
- Radiation shield: Deflects direct sunlight, improving temperature accuracy.
- Ventilated plastic box: Protects from moisture but lets air circulate.
Peter Gregory notes that his setup in a vented plastic container placed under his porch provided consistent data without environmental damage.
Step 6: Extending Functionality
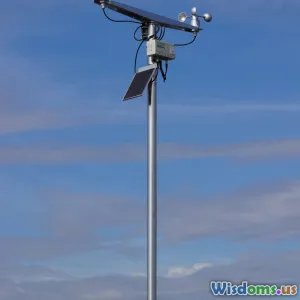
Your basic station can be enhanced by integrating more sensors:
- Wind speed/direction: Add an anemometer and wind vane.
- Rain gauge: To measure rainfall.
- UV sensor: Useful for solar radiation data.
- Solar power: Make the station autonomous.
Moreover, with Wi-Fi enabled Raspberry Pi, upload data to cloud services or your own web server with interfaces like Grafana for elegant real-time dashboards.
In the real world: The University of Chicago’s Spotter Network uses similar low-cost stations to crowdsource reliable weather data.
Conclusion
Building your own DIY weather station using Raspberry Pi is not only a profoundly educational project but also incredibly practical. Whether you’re a student learning about meteorological science or a hobbyist seeking to understand your microclimate, this project offers hands-on insight into sensors, coding, and data analysis.
From selecting affordable components to assembling the station and writing the necessary software, this project demystifies environmental data collection. As you advance, integrating additional sensors or cloud functionalities can transform your station into a sophisticated monitoring network.
The power to observe your local weather, understand patterns, and even predict changes is within your reach—all for the cost of a few components and an afternoon of dedication.
Are you ready to start your own weather station journey and turn technology into knowledge?
For further guidance and community support, consider visiting Raspberry Pi forums and maker platforms like Hackster.io or Instructables.
Rate the Post
User Reviews


Popular Posts


