
What Happens When Emissions Drop Rapidly
36 min read Clear, fast emissions cuts change air quality, temperatures, markets, and health. See immediate benefits, lagging climate responses, rebound risks, and policies that lock in durable decarbonization. (0 Reviews)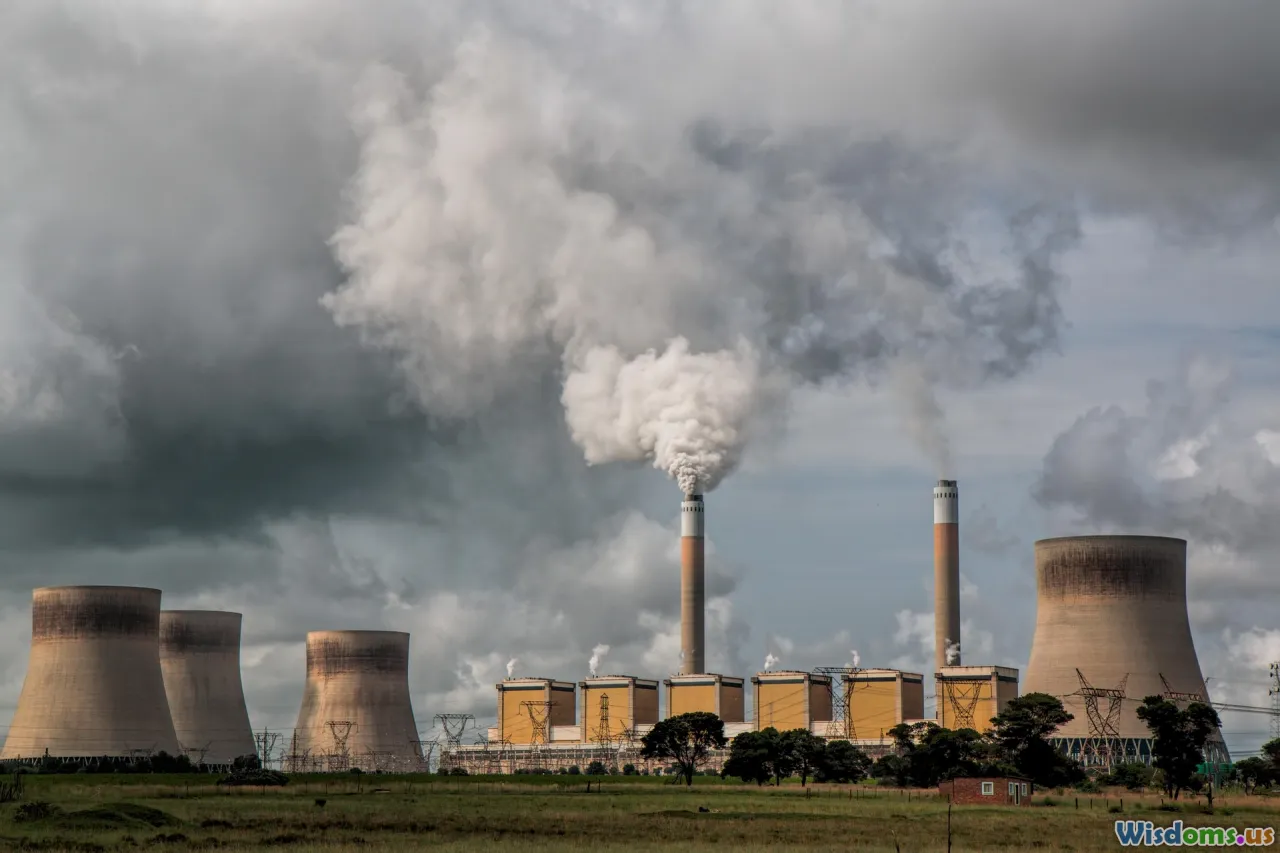
What Happens When Emissions Drop Rapidly
There is a common intuition that if we slam the brakes on emissions, the climate will respond like a car: immediate slowdown, quick relief. Reality is more like steering a supertanker. Some things change almost at once—skies clear, lungs get a break, noise levels fall—while other shifts unfold gradually over years, even decades. Understanding this timeline matters for policy, business planning, and public expectations. It helps us aim for the right outcomes, avoid preventable pitfalls, and measure progress in ways that keep momentum high.
This article maps what changes, when, and why, when emissions drop rapidly. It draws on examples from natural experiments like the 2020 pandemic, energy transitions playing out across continents, and the physics and chemistry that govern Earth’s atmosphere and oceans. It also offers practical guidance for making a steep decline in emissions stick without triggering backlash.
Emissions are a flow; warming is about the stock

The most important clarification in climate strategy is the difference between flows and stocks.
- Emissions are a flow—like water from a faucet. They are measured per year (for example, billions of tons of CO2 per year).
- Atmospheric concentration is a stock—like water in a bathtub. It is the cumulative result of previous flows.
- Warming responds primarily to the stock of long-lived greenhouse gases, not the current year’s flow.
Consider a bathtub with the drain partly clogged. Turning down the faucet immediately reduces the inflow, but the water level keeps rising until inflow falls to the rate at which water leaves through the drain. For CO2, the effective drain is a combination of ocean and land sinks that collectively remove only a fraction of our annual emissions. This is why concentrations keep climbing as long as net emissions are above zero.
Key implications of the stock-flow dynamic:
- If global CO2 emissions fall steeply but remain positive, atmospheric CO2 keeps increasing—just more slowly—so the rate of warming slows, but temperatures still rise.
- If net CO2 emissions reach zero, concentrations stabilize on human timescales and global average temperature stops increasing. In most models, temperatures then flatten and may edge down very slightly over many decades as the planet slowly releases heat stored in oceans.
- Short-lived pollutants behave differently. Methane (average atmospheric lifetime about 12 years) responds notably faster to emissions cuts; reduce methane emissions and concentrations begin to fall within a decade, delivering relatively quick cooling benefits. Aerosols (microscopic particles that cool the planet by reflecting sunlight) have lifetimes of days to weeks, so cutting aerosol pollution changes radiative balance almost immediately.
A useful rule of thumb: short-lived pollutants give fast responses; long-lived gases determine the long game. A rapid drop in emissions triggers both sets of processes at once.
What changes in the air within days to months

The atmosphere is dynamic, and some changes are visible within days when emissions fall sharply.
- Nitrogen dioxide (NO2), a short-lived pollutant from traffic and combustion, drops quickly. Satellite instruments that measure NO2 columns saw steep declines over locked-down cities in 2020. Similar patterns appear during major holidays with reduced traffic.
- Fine particulate matter (PM2.5) decreases. This directly improves air quality and has immediate health benefits, reducing asthma exacerbations and cardiovascular stress. WHO estimates millions of premature deaths annually from polluted air; even modest, temporary reductions can prevent hospital visits.
- Ozone chemistry can surprise. Urban ozone is shaped by volatile organic compounds (VOCs) and NOx (NO and NO2). Cutting NOx can sometimes raise ozone in city centers because there is less NO to destroy ozone (a process called titration), even as regional ozone falls. Cities that limit both VOC and NOx pollution see clearer gains.
- Reduced aerosol cooling is felt right away. Sulfur dioxide (SO2) from coal plants, shipping, and industrial sources forms reflective aerosols that cool the atmosphere. When those emissions fall, the masking effect weakens, allowing more sunlight to reach the surface. This yields a small, near-term warming bump in regions where aerosol reductions are large.
Evidence and examples:
- The 2020 pandemic saw daily global CO2 emissions fall sharply at the peak of lockdowns, and NO2 plummeted in urban areas like Wuhan, Milan, and Los Angeles. People noticed vivid blue skies. Yet global CO2 concentration still increased that year—just by a smaller increment—because the overall stock kept rising.
- Ship-tracking maps and atmospheric data show that tightening fuel sulfur limits for shipping in 2020 reduced sulfate aerosols along major sea lanes. Studies suggest this modestly increased sunlight reaching the ocean surface, with a small regional warming and cloud-brightness change near shipping routes.
Bottom line for the near term: rapid emissions drops deliver immediate, human-visible benefits for air quality, but also reduce aerosol cooling, which partly offsets the short-term climate payoff. This is not a flaw in the strategy—it’s a predictable, manageable trade-off that should be anticipated in communications and policy design.
The climate response: years to decades
On climate timescales, the questions shift to warming trends, stabilization, and risk. The Earth system integrates over decades.
- CO2: Cutting CO2 deeply lowers the rate at which the atmospheric concentration rises. Reach net zero, and temperature rise halts. Because the ocean continues to take up heat, the best estimate is that global mean temperatures stabilize within a couple of decades of reaching net-zero CO2. Maintain net-zero total greenhouse gases (including methane and nitrous oxide), and some analyses project a slight decline in temperatures afterward.
- Methane: Because it is short-lived, a rapid drop in methane emissions can translate into measurable cooling within about a decade. This matters for near-term risk, including heat extremes. Programs to fix leaks in oil and gas systems, manage landfill gas, and improve livestock practices are among the quickest levers we have.
- Aerosols: As noted, removing reflective aerosols removes a small cooling influence. Global modeling suggests that fully eliminating anthropogenic aerosols would cause some additional warming in the near term (often characterized as a few tenths of a degree Celsius). That warming is already expected in any clean-air pathway, and it need not derail climate goals if CO2 and methane are cut decisively.
Temperature trajectory and the carbon math:
- The temperature response to cumulative CO2 is approximately linear over a wide range. A commonly cited value for the transient climate response to cumulative carbon emissions (TCRE) is about 0.45°C per 1,000 gigatons of CO2, with uncertainty on either side. Put differently, avoiding 100 gigatons of cumulative CO2 could avert roughly 0.05°C of warming, all else equal.
- This makes the pace and timing of reductions critical. A sharp drop now avoids emissions immediately and reduces cumulative totals for decades, easing later obligations.
Extreme events and variability:
- Even after emissions fall, year-to-year temperature noise continues due to El Niño/La Niña cycles and internal variability. It is possible to have record-hot years during or after emissions cuts if an El Niño coincides with ongoing background warming. The correct lens is trend, not a single year.
- Some extremes respond quickly to methane cuts (heatwaves can be influenced by background warming that methane reduction eases). Others—such as sea-level rise driven by thermal expansion and ice loss—play out over longer periods and depend on sustained mitigation.
Oceans: heat, chemistry, and life

Oceans absorb more than 90% of the excess heat trapped by greenhouse gases and about a quarter of CO2 emissions. When emissions drop rapidly, the ocean’s responses stagger across different timelines.
- Heat content: Even with deep emissions cuts, the upper ocean keeps warming for a time because heat continues to mix downward. This momentum is why sea-level rise from thermal expansion persists even after CO2 emissions fall.
- Chemistry: If we curb CO2 quickly, the pace of ocean acidification slows. The chemistry is straightforward: less CO2 dissolving into seawater means a slower drop in pH and less decline in carbonate ions that corals and shellfish need to build skeletons. To actually reverse acidification, net negative CO2 (removing more than we emit) would be needed for a sustained period.
- Ecosystem stress: Fewer co-pollutants can yield quick gains in coastal zones. Cutting nitrogen oxides and ammonia reduces nutrient deposition that can feed algal blooms. Reducing shipping and port traffic lowers noise in key habitats. During 2020, some researchers documented reduced shipping noise that likely benefited marine mammals—an example of how quickly certain stressors can lift.
Practical ocean outcomes to monitor:
- Aragonite saturation states on reefs: Slower acidification improves the odds for coral restoration and resilience projects.
- Marine heatwave frequency: These events are sensitive to background warming and ocean dynamics. Methane cuts that cool the near-term climate can reduce the frequency and intensity of heatwaves over the next couple of decades.
- Deoxygenation trends: Reducing warming slows the loss of oxygen in mid-depth waters over decades, with benefits for fisheries.
Case studies and natural experiments

We rarely conduct intentional large-scale experiments on the planet, but several episodes offer insight into what happens when emissions or pollution drop fast.
- Global pandemic in 2020: Daily carbon emissions plunged at the height of lockdowns, with a yearly reduction estimated in the mid-single digits compared to 2019. Satellite data showed NO2 levels collapsing over major cities, and ground monitors recorded cleaner air. Despite this, atmospheric CO2 concentration still rose that year; the stock was simply growing slower. Notably, urban ozone behaved nonlinearly in some locations, underlining the chemistry caveats discussed earlier. Once activity resumed, emissions rebounded, underscoring how structural changes—not just temporary behavior shifts—are needed for durable declines.
- Clean Air Acts and policy cycles: The United States and Europe saw dramatic declines in sulfur dioxide and particulate pollution after clean-air legislation and technological controls. The benefits arrived quickly for visibility and health. Climate models and observations indicate that as aerosols dropped, some of the previously masked warming became apparent, matching expectations. This co-benefit story—immediate health gains alongside careful climate planning—is a repeatable template.
- Power-sector transitions: The UK has run extended periods with no coal on its grid, and several countries now get meaningful shares of electricity from wind and solar. Rapid coal-to-gas switching in some regions cut CO2 intensity quickly due to gas’s lower carbon per unit of energy, though methane leakage rates determine the net benefit. Where renewables surged alongside storage and flexible demand, emissions fell while reliability held steady—evidence that systemic planning can make steep reductions practical.
From these episodes, two lessons stand out:
-
Institutional design matters. Emissions decline pathways that are backed by market rules, infrastructure investment, and social support survive shocks and rebounds. One example is carbon market designs that include mechanisms to absorb swings in demand and prevent price collapses.
-
Chemistry and physics are consistent. Air quality responds fast; the climate signal emerges over years. Plans and messages must reflect this cadence to maintain credibility.
Economic and energy-system ripple effects

A rapid emissions drop rarely happens in isolation; it ripples through energy markets, supply chains, and investment strategies.
- Commodity prices: Lower demand for fossil fuels tends to depress prices in the short term. That can reduce the cost of operating existing fossil equipment, which raises the risk of a rebound if policy signals are weak. Floor prices in carbon markets, clean procurement, and standards help maintain the economics of clean alternatives through the downturn.
- Grid dynamics: Steep increases in renewable generation typically bring more hours with low or even negative wholesale prices, especially at midday in solar-heavy systems and during windy nights. Without flexibility, this leads to curtailment. With the right market rules and investments, it becomes an opportunity: storage charges cheaply, EVs schedule smart charging, industrial loads shift, and green hydrogen projects run opportunistically.
- Reliability and ramping: When fossil generation declines quickly, systems need more flexibility from storage, demand response, interregional transmission, and fast-start plants. Regions like South Australia have shown that high shares of wind and solar can coexist with reliability by leveraging these tools and enforcing grid-forming inverter standards.
- Stranded assets: Rapid declines in demand can turn long-lived fossil assets into financial risks. Early retirement programs, securitization, and mechanisms to refinance remaining book value can ease the transition while protecting ratepayers. Investors increasingly scrutinize transition risk in credit ratings and lending.
- Industrial supply chains: Emissions cuts in heavy industry often hinge on new capital cycles—electrified heat, hydrogen-based direct reduction of iron, or carbon capture retrofits. If demand drops suddenly, capital spending may stall. Targeted incentives and contracts for difference can keep decarbonization investment flowing despite volatility.
A strategy that anticipates these market dynamics can turn a disruptive drop in emissions into an orderly pivot rather than a whiplash event.
Rebound effects and how to prevent them

Rebound is the tendency for efficiency gains or temporary drops in activity to be offset by increased use later. It is a recurring phenomenon when emissions fall quickly but structural changes lag.
Common rebound channels:
- Cheap fuels and electricity: When demand drops, prices fall, and usage creeps back up. This can erase part of the emissions reduction.
- Behavioral rebound: After a period of restraint, people and businesses may overcompensate with more travel or consumption.
- Outsourcing: Emissions decline domestically while imports rise from higher-emitting supply chains elsewhere.
Practical guardrails:
- Lock in savings with standards. Efficiency standards for buildings, appliances, vehicles, and industrial equipment ensure that as activity returns, it does so with lower intensity.
- Price floors and caps. Carbon price floors, advanced market commitments for clean power, and minimum clean-content rules prevent clean projects from being displaced by a temporary wave of cheap fossil energy.
- Demand-side programs. Time-of-use rates and automated demand response keep the grid aligned with clean generation patterns, reducing the need to ramp fossil plants.
- Border adjustments and procurement. Carbon border adjustments and green public procurement mute outsourcing and create consistent demand for low-emission products.
Designing for rebound is not pessimism; it is engineering for human nature and market physics.
Health and equity co-benefits

Rapid emissions cuts often bring immediate public health improvements that are distributed unevenly—both the harms and the benefits.
- Air pollution relief: Declines in PM2.5 and NO2 reduce hospital admissions for respiratory and cardiovascular illness within days to weeks. Long-term, sustained lower exposure yields months to years of life expectancy gains in polluted regions. People living near highways, ports, and industrial corridors often see the greatest relief.
- Heat exposure: Mitigating methane and overall warming reduces heatwave intensity over time. Coupling emissions cuts with urban heat strategies—cool roofs, tree canopy, and reflective pavements—multiplies benefits, especially for vulnerable populations.
- Indoor air quality: Shifting away from combustion in homes (gas stoves, unvented heaters) reduces nitrogen dioxide and particulates indoors. This can be one of the fastest health gains per dollar when combined with weatherization and ventilation upgrades.
- Job quality and transition: Communities dependent on fossil industries need tangible pathways into clean-energy and infrastructure jobs. Early, well-financed transition planning reduces the social costs of change and builds durable coalitions for continued emissions reductions.
Equity lens in practice:
- Target investments where pollution is highest and incomes are lowest. Measures like electric bus deployment, port electrification, and building retrofits should prioritize these areas first.
- Engage local expertise. Community groups can help identify practical barriers and co-design programs, increasing uptake and trust.
- Measure benefits. Track air quality, health metrics, energy burden, and job outcomes so benefits are visible and policies can course-correct.
Designing a rapid drop that sticks: a 10-point playbook

A steep, sustained emissions decline is achievable with foresight. Here is a pragmatic sequence to avoid common bottlenecks and backlash.
-
Cut methane early and hard. Methane’s short lifetime makes it a fast win. Prioritize leak detection and repair in oil and gas, capture landfill gas, reduce venting and flaring, optimize rice cultivation, and improve manure management. The cooling effect arrives within a decade.
-
Clean the grid first. Electrification only pays off if the power source is clean. Accelerate wind, solar, geothermal, and firm low-carbon options; streamline interconnection queues; and invest in transmission. Pair with storage and grid-forming inverters to keep stability strong as fossil plants retire.
-
Electrify end uses with standards. Lock in progress by requiring that new equipment—vehicles, heat pumps, water heaters, industrial motors—be electric or compatible with low-carbon fuels where feasible. Set dates well ahead of capital refresh cycles.
-
Build flexibility into markets. Implement time-varying rates and automated demand response so that flexible loads follow renewable output. Create ancillary service markets that value fast response from storage and inverters.
-
Keep prices aligned with goals. Use carbon price floors, clean-energy credits, or contracts for difference to de-risk investment through market swings. Avoid relying solely on average commodity prices.
-
Sequence transport reforms. Pair EV adoption with charging networks, workplace and public charging, and managed charging rules. Encourage mode shift with bus lanes, improved service frequency, and safe cycling and walking infrastructure to reduce vehicle miles traveled.
-
Manage the aerosol transition. Expect short-term warming when sulfur aerosols fall. Communicate this upfront, and counter with faster methane cuts and accelerated CO2 reductions. Maintain strict clean-air rules; the health benefits are immediate and large.
-
Protect consumers and workers. Use targeted rebates, on-bill financing, and retraining programs. Bundle energy upgrades—weatherization, heat pumps, induction cooking—to maximize household benefits and minimize disruption.
-
Monitor, verify, and adjust. Build a transparent data system: hourly grid emissions intensity, methane leak rates, air quality by neighborhood, and project pipelines. Use the data to pivot quickly when bottlenecks emerge.
-
Lock in land and ocean sinks. Stop deforestation, restore forests and wetlands, and improve soil carbon in agriculture. Sinks complement energy-sector cuts and provide resilience.
This playbook shifts a rapid drop from accident to strategy—less whiplash, more durability.
Pitfalls and myths to avoid

- Myth: Emissions fell this year; why didn’t temperatures drop? Reality: The climate responds to the total accumulated stock of greenhouse gases. It takes sustained cuts to alter long-term temperature trends. However, air quality improves almost at once.
- Myth: Cleaning the air makes climate action self-defeating because it warms the planet. Reality: The short-lived cooling from aerosols is not a viable climate lever given the massive health harms. Robust CO2 and methane cuts overwhelm the aerosol effect over time. We can enjoy clean air and a stable climate.
- Pitfall: Overpromising immediate climate outcomes. If you promise that a policy will cool summers next year, you set it up to fail in the public eye. Promise the right things: cleaner air now, jobs and new industries soon, and a safer climate as the decade progresses.
- Pitfall: Ignoring system bottlenecks. Transmission lines, interconnection backlogs, and permitting delays can stall clean projects even as emissions targets tighten. Planning and reform must run ahead of targets.
- Pitfall: Assuming behavior alone will carry the day. Temporary behavior changes rarely persist without infrastructure and incentives that make the clean choice the easy, cheaper, default choice.
What to watch in the data

When emissions drop rapidly, a good dashboard helps decision-makers and the public track cause and effect on the right timelines.
Near-term (days to months):
- NO2 columns over major cities via satellite; PM2.5 at ground monitors; ozone patterns across urban and suburban monitors.
- Grid emissions intensity hour by hour; curtailment levels for wind and solar; frequency of negative price intervals.
- Methane leak rates from energy basins via aircraft, satellite, and ground sensors.
Medium term (1–5 years):
- Annual CO2 concentration growth rate (the Keeling Curve slope); carbon intensity of GDP and of electricity.
- Health metrics: asthma ER visits, cardiovascular admissions, and mortality associated with air quality.
- Industrial deployment: heat pump sales, EV share of new vehicles, electrolyzer and storage capacity added, interconnection queue throughput.
Longer term (5–20 years):
- Temperature trends relative to pre-drop trajectories; frequency and intensity of heatwaves.
- Ocean indicators: pH trends in coastal and open-ocean stations; marine heatwave metrics; deoxygenation rates.
- Land-use outcomes: deforestation rates, restoration acreage, soil carbon changes.
A transparent, widely accessible dashboard builds trust and helps maintain momentum when the immediate climate signal is subtle.
A realistic timeline of change

To make the cadence concrete, imagine an economy that cuts net greenhouse gas emissions in half within a decade, with most of the early reductions coming from power and methane.
- Month 1–3: Satellite images show NO2 plummeting over power plant clusters and congested corridors as coal plants retire and traffic policies shift. Ground-level PM2.5 falls; hospitals see fewer pollution-related admissions. The grid experiences more hours with low prices as new renewables flood in; storage projects ramp up.
- Year 1–2: CO2 concentration still rises, but the annual growth rate ticks lower. Methane monitoring networks show notable declines in oil and gas fields, and landfill gas capture expands. Cities update building codes to favor electrification; consumers adopt heat pumps and induction cooking with rebates.
- Year 3–5: Peak emissions occur and begin a steady decline. Reliability holds with expanded transmission and storage. Industrial pilots demonstrate low-carbon cement and steel at commercial scale. Air quality benefits persist and expand to previously neglected neighborhoods as targeted programs reach them.
- Year 5–10: The warming trend begins to diverge visibly from the pre-reduction trajectory. Extreme heat events remain, but their baseline intensity is lower than it would have been. Marine heatwaves are still a risk, but their frequency is tempered. Communities formerly tied to coal have diversified economies through planned transition funds and retraining.
- Year 10+: With net zero in sight, temperatures stabilize relative to the earlier upward march, and continued improvements in ocean chemistry preserve options for reef restoration and shellfish industries. Negative emissions projects, where appropriate and carefully governed, begin to counter historical overshoot.
This trajectory is not guaranteed, but it is technically and economically feasible with coordinated policy, investment, and social support.
Practical steps for businesses and cities

- Conduct a stock-and-flow audit. Map your short-lived pollutants (like methane, black carbon, and NOx) versus long-lived emissions. Prioritize quick wins that buy time.
- Stage infrastructure upgrades. Electrify fleet vehicles aligned to charging availability; phase in building retrofits by tackling envelopes and heat pumps in tandem to avoid stranded equipment.
- Use performance-based contracts. Tie vendor and utility contracts to delivered emissions cuts and uptime, not just installed capacity.
- Hedge against rebound. Lock in long-term clean power purchase agreements with indexed pricing. Adopt internal carbon price floors to shield investments from market dips.
- Measure what matters. Publish hourly emissions intensity for operations, methane intensity for fuels, and health co-benefits where relevant. Transparent, granular data keeps stakeholders aligned.
Communication tips that maintain trust

- Set expectations clearly. Promise clean air now and climate stabilization over the decade, not overnight cooling.
- Explain the aerosol effect simply. Acknowledge that cleaning the air removes a temporary cooling haze; emphasize that health gains are immediate and climate gains compound with CO2 and methane cuts.
- Tell local stories with data. Pair satellite and sensor visuals with neighborhood-level health and economic benefits.
- Celebrate milestones that matter. Coal-free days, interconnection backlogs cleared, methane leaks repaired, and zero-emission buses on the road are all tangible proof points.
A good narrative keeps public support strong through the timeline mismatch between fast air quality gains and slower climate outcomes.
The bigger picture: why speed still matters

A rapid emissions drop pays dividends that grow over time:
- It avoids cumulative CO2, the variable that most tightly controls long-term warming. Every ton not emitted keeps us away from thresholds that are costly or irreversible on human timescales.
- It buys time for adaptation. Slower warming and near-term methane reductions can ease the strain on health systems and infrastructure as we scale up resilience.
- It compacts learning curves. Deploying clean technologies at scale lowers costs faster, making future reductions cheaper and widening access.
- It clears the air—literally—delivering immediate health gains that save lives and reduce disparities.
Perhaps most importantly, speed creates credibility. When people see cleaner air, reliable power, and good jobs arrive together with emissions falling, support for deeper structural change grows. That is how a rapid drop becomes a durable transition.
We do not need to wait decades to feel some of the benefits of decisive climate action; many arrive in days and weeks. The rest accrue steadily so long as we keep our hand on the wheel—focusing on the stock as much as the flow, sequencing smart policies, and telling the story with clarity and humility. The supertanker won’t turn on a dime, but with sustained pressure on the rudder, it does turn—and soon the horizon changes.
Rate the Post
User Reviews
Other posts in Renewable Energy


Popular Posts


