Five Misconceptions About the Cosmic Microwave Background
25 min read Debunks five myths about the Cosmic Microwave Background, using Planck and WMAP results to explain its origin, faint anisotropies, spectrum, visibility, and what it truly reveals about the early universe. (0 Reviews)
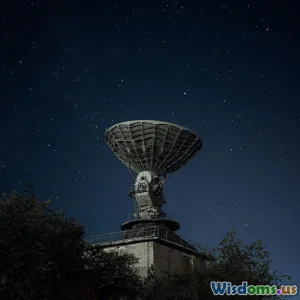
The faint hiss that Arno Penzias and Robert Wilson heard in 1964 was not a malfunctioning antenna, nor the pigeons they tried (unsuccessfully) to blame. It was the whisper of the early universe—the cosmic microwave background (CMB). Today, the CMB is one of the most precisely measured signals in all of science, and yet it’s still surrounded by myths that muddle what it is and what it tells us. Let’s clear up five of the most persistent misconceptions about the CMB and, along the way, equip you with a few practical tools for interpreting CMB maps, headlines, and claims.
1) “The CMB is just 3 K static—featureless and boring.”

If you’ve seen a global CMB map—an oval-shaped projection of the entire sky painted in reds and blues—you might come away thinking the pattern is just splashy artistry. In fact, those color blotches are the entire point. The CMB is astonishingly uniform on average, with a nearly perfect blackbody spectrum at a temperature of about 2.725 K. But it is not perfectly smooth. When cosmologists say the CMB is uniform, they’re emphasizing the average spectrum and temperature; when they say it’s rich with structure, they’re talking about the tiny anisotropies—temperature fluctuations at the level of tens of microkelvin—that record sound waves in the primordial plasma.
What does “tiny” mean? Roughly one part in 100,000. The overall temperature is 2.7 K; the hot and cold patches deviate by mere tens of microkelvin. These ancient ripples, first mapped clearly by COBE in the early 1990s and later in exquisite detail by WMAP and Planck, encode a treasure trove of physics:
- The characteristic scale of the first acoustic peak, around one degree on the sky, corresponds to the sound horizon at last scattering—about 150 megaparsecs (comoving). This scale pins down the geometry of the universe and strongly supports flatness.
- The heights and spacing of the acoustic peaks in the angular power spectrum reveal the baryon density, the dark matter density, and the rate of expansion. That’s how we got today’s precise estimates of the universe’s contents.
- Polarization patterns, split into E-modes and B-modes, add further constraints. E-modes, detected two decades ago, trace velocity and density gradients in the early plasma; lensing-induced B-modes, now routinely measured, trace large-scale structure between us and the CMB. Limits on primordial B-modes currently constrain the tensor-to-scalar ratio r to below about 0.036, putting tight bounds on inflationary energy scales.
One more subtlety: the largest feature in the CMB is not primordial; it’s the “dipole”—a hot side and a cold side spanning the whole sky, caused by our motion relative to the CMB rest frame. Its amplitude is about 3.3 millikelvin, corresponding to roughly 370 km/s. Cosmologists always subtract this dipole before analyzing the primordial fluctuations.
How to read CMB maps like a pro:
- Check the units: are temperatures in microkelvin (μK) relative to 2.725 K, or in “K_CMB” thermodynamic units? Color bars can be misleading without units.
- Ask whether the dipole and foregrounds (Galactic dust, synchrotron, free-free emission) have been subtracted. A “clean” CMB map is a composite across frequencies designed to cancel foregrounds—no single frequency map is pure.
- Remember the dynamic range: a bright red patch is still only tens to hundreds of microkelvin above average. The drama is scientific, not thermal.
The upshot: the CMB is not boring; it is exquisitely structured in exactly the way predicted by early-universe physics. Those tiny ripples are the seeds of galaxy clusters, filaments, and voids we inhabit today.
2) “It’s a photograph of the Big Bang (or of an ‘edge’ of the universe).”
The CMB is not a snapshot of the Big Bang itself. It’s a portrait of the universe roughly 380,000 years after the Big Bang, when the cosmos cooled enough for electrons and protons to combine into neutral hydrogen. Before that epoch—called recombination and photon decoupling—the universe was an opaque plasma; photons scattered constantly off free electrons. When atoms formed, the fog lifted, and photons began to stream freely. Those are the photons we see today as the CMB.
Calling the CMB the “surface of last scattering” is helpful: imagine you’re in a foggy room where a fog bank suddenly dissipates. You don’t see the very first moment the fog formed; you see the last place photons scattered on their way to your eyes. In our case, that “surface” is a spherical shell around us at a redshift of about z ≈ 1100.
So where is the “edge”? There isn’t one, not in the sense of a boundary wall. The surface of last scattering is everywhere around us because the universe is homogeneous and isotropic on large scales. There’s no special center or edge. What we call the “CMB sky” is a 2D projection of that 3D spherical shell. If you were standing in a galaxy billions of light-years away, you would map a CMB sky that looks statistically the same, with you at the center of your own spherical shell. That’s a consequence of cosmic homogeneity.
Key numbers and what they mean:
- Redshift and temperature: At recombination (z ≈ 1100), the radiation temperature was about 3000 K—similar to the surface of a red dwarf star. Today, after the universe expanded by a factor of ~1100, the same radiation appears as microwave light at 2.725 K.
- Distances: The comoving distance to the last scattering surface is about 46 billion light-years. That big number reflects the fact that while the CMB photons were en route, space itself continued to expand.
- Timescales: The CMB shows us the universe when it was a few hundred thousand years old—not the first instant after the Big Bang. To probe earlier times, cosmologists look for complementary signals such as primordial gravitational waves, the cosmic neutrino background, and 21-cm radiation from the cosmic “dark ages.”
How to explain it to a friend in one sentence:
- We haven’t photographed the Big Bang; we’ve photographed the universe’s first clear view of itself, a baby picture taken when it was about 380,000 years old.
Practical tip: When you see headlines claiming “We saw the universe’s beginning,” look for details. If the story is about a new CMB map, it’s about the afterglow of recombination. Claims about earlier epochs should reference different observables (e.g., 21-cm cosmology, gravitational waves, or neutrinos).
3) “Space is 3 K everywhere; you can’t get colder than the CMB.”
The CMB’s 2.7 K temperature is the temperature of the cosmic radiation bath—not a thermostat for everything else. It sets a limit for passive radiative cooling to deep space, but it does not forbid matter from becoming colder under the right conditions.
Examples that knock down this myth:
- The Boomerang Nebula is the coldest known natural object, with gas temperatures measured around 1 K. It achieves this by expanding so rapidly that the gas cools adiabatically faster than it absorbs ambient radiation.
- In laboratories, physicists cool atoms to microkelvin and even nanokelvin temperatures using laser cooling and evaporative techniques. These systems require continuous input of work and are shielded from external radiation; they’re not limited by the CMB because they’re not in passive radiative equilibrium with it.
- Spacecraft and observatories regularly operate far below 2.7 K using active cooling. Planck’s High Frequency Instrument reached about 0.1 K with a dilution refrigerator. NASA’s JWST passively cools to around 40 K with a multi-layer sunshield and uses cryocoolers to push some instruments even colder.
So what does the CMB limit in practice? If you place an object in deep space with an unobstructed view of the sky and no active cooling, the floor for purely radiative equilibrium is set by the radiation field surrounding it. In our universe, that includes the CMB plus starlight, zodiacal light, interstellar dust emission, and any local sources (Sun, planets). Near Earth, the effective radiation temperature is far higher than 2.7 K because solar and terrestrial radiation dominate. Far from stars and dust, with adequate shielding, an object can approach 2.7 K via passive radiation to the sky—but not go below it without doing work (i.e., active cooling), changing its view factor (e.g., enclosing it in a colder cavity), or using adiabatic expansion like the Boomerang Nebula.
Actionable guidelines for engineers and enthusiasts:
- If your system relies on passive radiative cooling in interplanetary space, assume equilibrium temperatures in the tens to hundreds of kelvin unless well-shielded from sunlight and planetshine.
- To approach the CMB floor passively, maximize sky view, minimize absorptivity to local sources, and use multi-stage sunshields. JWST’s five-layer sunshield is a masterclass in angular shielding.
- To go below the CMB temperature, plan for active cryocoolers, closed-cycle dilution refrigerators, or adiabatic demagnetization—techniques that move heat out of your system rather than relying on the ambient radiation bath.
One more nuance: “temperature” can refer to different things—radiation temperature, kinetic temperature of gas, or internal temperature of a solid. The CMB’s “temperature” is a property of the photon distribution; there’s no contradiction if matter is colder (or hotter) than that distribution at a given place and time.
4) “The CMB ‘Cold Spot’ proves a multiverse (or a gigantic supervoid).”

Across the CMB sky there’s a region often called the “Cold Spot,” a patch a few degrees wide that looks cooler than its surroundings. It’s real in the maps, first noticed in WMAP data and confirmed in Planck data. But does it demand new physics? The sober answer: not yet.
What it is: The Cold Spot is a region whose average temperature fluctuation is unusually negative compared to what a typical Gaussian random field might produce. Depending on the statistic chosen (there are many), its rarity is quoted at the level of a few percent to a few tenths of a percent—numbers that sound dramatic, but which must be interpreted carefully given the so-called “look-elsewhere effect.” If you scan the entire sky with many filters and many statistics, you’re likely to find something that looks odd.
Supervoid hypothesis: Surveys have found a large underdensity of galaxies in roughly the same direction, sometimes called the Eridanus supervoid. A supervoid can create a cold imprint via the Integrated Sachs–Wolfe (ISW) effect: as CMB photons traverse a decaying potential (in a dark energy–dominated universe), they can lose a bit of energy. Could this supervoid be responsible? Modeling suggests it might explain some of the temperature decrement, but not all of it. The magnitude predicted by linear ISW for plausible void profiles generally falls short of the observed Cold Spot depth.
Multiverse claims: Some speculative models predict rare topological defects or bubble collisions between pocket universes, which could leave disc-like imprints. The Cold Spot has been discussed in that context, but this is not a necessary nor uniquely supported explanation. When Planck reassessed the Cold Spot using multiple statistics and sky masks, they found its anomalous nature to be marginal once a posteriori choices were accounted for. In other words, intriguing but not compelling evidence for exotic physics.
How to spot hype:
- Does the study correct for the look-elsewhere effect? If not, quoted “sigma” levels are likely overstated.
- Is the claimed explanation accompanied by a prediction for other, independent observables (e.g., lensing, polarization, or specific signatures in galaxy surveys) that can be checked? Strong claims need cross-validation.
- Are multiple statistics consistent? If only one cherry-picked metric shows tension and others do not, be cautious.
Takeaway: The Cold Spot remains an interesting feature worth studying, but it is not a smoking gun for the multiverse or any radical departure from standard cosmology. As data improve and more cross-correlations are performed, we’ll either demote it to a statistical oddity or uncover convergent evidence for something deeper. Right now, the weight of evidence leans toward the former.
5) “CMB photons were always microwaves—they didn’t ‘cool.’”

Microwaves are not a fixed identity; they’re a wavelength band. The CMB’s photons haven’t always been microwaves. They began as higher-energy photons in the hot early universe and were stretched to microwaves by cosmic expansion.
Here’s the logic:
- The spectrum: The CMB is extraordinarily close to a perfect blackbody—so close that COBE’s FIRAS instrument measured deviations smaller than a few parts in 100,000. The effective temperature is T ≈ 2.725 K today.
- Wien’s law: A blackbody’s peak wavelength is λ_max ≈ 2.9 mm·K / T. Plug in T ≈ 3000 K at recombination and you get λ_max ≈ 970 nm—near-infrared light. The same photons are measured today with a peak around 1 mm, right in the microwave regime.
- The redshift factor: Expansion stretches wavelengths by 1 + z. From z ≈ 1100 to now, wavelengths expanded by the same factor. A 1 μm photon at last scattering becomes a ~1.1 mm photon today—a microwave. That’s why the whole CMB spectrum “cooled”: as space expanded, the photon bath diluted and shifted to longer wavelengths, preserving its blackbody form.
Why the spectrum stays a blackbody: In the very early universe (z ≳ 10^6), interactions were frequent enough (Compton scattering, double Compton scattering, Bremsstrahlung) to thermalize any injected energy and maintain a blackbody. As the universe expanded and thinned, those processes froze out. From that point forward, the CMB’s shape has been preserved with extraordinary fidelity, except for subtle effects:
- Tiny spectral distortions are expected from the damping of small-scale acoustic waves (Silk damping), the reionization of the universe, and the Sunyaev–Zel’dovich (SZ) effect from hot electrons in galaxy clusters. COBE’s FIRAS constrained y-type and μ-type distortions to be less than roughly 10^(-5). Proposed missions like PIXIE and PRISM aim to push sensitivity orders of magnitude deeper, potentially detecting the expected “fossil” distortions from early-universe processes.
- Gravitational lensing remaps CMB photons but preserves the spectrum. It’s why we can statistically reconstruct the intervening matter distribution without changing the CMB’s blackbody nature.
Foregrounds don’t change this story: Galactic dust emits thermally at tens of kelvin with a greybody spectrum; synchrotron and free-free radiation have power-law spectra; radio and infrared galaxies add their own signatures. None of these are the CMB, and all can be disentangled because they scale differently with frequency. That’s why CMB observatories measure across many bands—from tens to hundreds of gigahertz. By fitting the frequency dependence, experiments can isolate the true CMB fluctuations and their polarization.
Quick guide to frequency maps:
- If a “CMB” image is from a single frequency (say 353 GHz), it’s likely dominated by dust; if it’s at 30 GHz, synchrotron may dominate. A true CMB map is a carefully cleaned composite.
- Headlines about “microwaves from the Big Bang seen at 150 GHz” are shorthand for “we measured the CMB anisotropies at 150 GHz where the CMB signal is strong and dust is manageable.” It’s not that the CMB exists only at that frequency; the CMB spans a broad microwave band with a blackbody shape.
- When you see a unit like “μK_CMB,” that means temperature fluctuations expressed in thermodynamic temperature units of the CMB—appropriate for comparing data across frequencies using the CMB spectrum as the conversion standard.
What if the spectrum weren’t a blackbody? That would be a red flag. Stellar light, scattered radio waves, or any astrophysical mixture can’t produce a perfect blackbody at 2.725 K across the entire sky. That singular success—plus the minute anisotropy pattern—was a knockout blow for steady-state models and a major validation of hot Big Bang cosmology.
—
To navigate CMB news with confidence, keep these practical habits in your toolkit:
- Always check what has (and hasn’t) been subtracted. The raw sky is a mix of CMB plus foregrounds, and the order of operations matters: remove dipole; model and subtract Galactic dust and synchrotron; combine frequencies; analyze the residual.
- Separate map space from power spectrum space. Maps are intuitive but can mislead; power spectra quantify fluctuations rigorously, and their peaks and troughs are where cosmological parameters are read off.
- Look for cross-checks. Robust claims tend to be supported by multiple experiments (e.g., WMAP and Planck) and multiple observables (temperature, polarization, lensing, galaxy cross-correlations).
- Treat anomalies with statistical caution. A five-sigma signal pre-specified beforehand is compelling; a two- to three-sigma oddity found after numerous trials calls for restraint.
The CMB’s subtle ripples are the universe’s first diary: a record of pressure waves, gravity, and light negotiating a primordial plasma. They are far from featureless; they do not show the very first moment of creation; they do not set an absolute freezer limit for matter; and while they contain oddities worth chasing, they require careful, multichannel analysis before rewriting the textbooks. Behind the color maps lies a disciplined interplay of theory, measurement, and statistical inference—one that has given us a remarkably self-consistent picture of a flat, expanding universe filled with dark matter, dark energy, and a faint glow that began in the near-infrared and has since been stretched to microwaves by the grandest expansion we know. As new instruments refine our view—mapping polarization with higher sensitivity, hunting for tiny spectral distortions, and crossing CMB data with ever-better galaxy surveys—expect fewer myths and more nuance. That’s good news: the clearer the CMB becomes, the more precisely it can guide us through the universe’s earliest chapters and toward the questions we haven’t yet learned how to ask.
Rate the Post
User Reviews
Popular Posts


