
From Data to Art How to Visualize Statistics for Business Impact
7 min read Transform complex statistics into compelling visuals that drive business success and informed decision-making. (0 Reviews)
From Data to Art: How to Visualize Statistics for Business Impact
Introduction
In today's fast-paced business environment, data is omnipresent but often overwhelming. Executives and decision-makers are inundated with spreadsheets, reports, and endless streams of numbers. Yet, numbers alone don’t create impact. The real magic happens when raw data is transformed into a visual narrative that captivates the audience, sparks insights, and drives informed action. This transformation is where art meets science—turning statistics into visually striking stories that resonate.
Imagine a CEO glancing at a report showing quarterly sales growth; a simple table doesn't inspire. But a well-crafted line chart illustrating consistent upward trends alongside competitor benchmarks can prompt strategic decisions and ignite innovation. This article explores how businesses can make this leap—from data overload to data storytelling art—to maximize business impact.
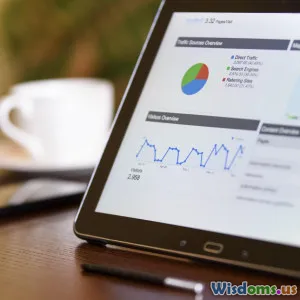
The Power of Data Visualization in Business
Why Visualization Matters
Visual perception is a powerful tool in understanding and communicating complex data. According to a study from 3M Corporation, visuals are processed 60,000 times faster than text by the human brain. This rapid processing is crucial in business, where time is valuable and decisions must be precise.
Good visualizations summarize volumes of data concisely, reveal hidden patterns, and identify anomalies that may otherwise be missed. Beyond internal use, they boost stakeholder engagement, improve cross-departmental collaboration, and even enhance customer understanding.
Real-World Example: Airbnb
Airbnb extensively leverages data visualization to optimize customer experiences. Using dynamic dashboards, they combine geospatial heatmaps with booking trends and user demographics. This fusion allows operations teams to pinpoint demand spikes, adjust pricing, and improve host engagement—all driven by intuitive visuals.
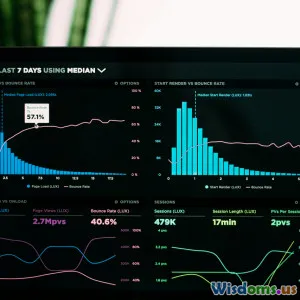
From Numbers to Narratives: Key Principles
Choose the Right Chart for the Data
Choosing an appropriate visualization method is foundational:
- Line charts effectively show trends over time. For example, tracking monthly revenue growth.
- Bar charts compare discrete categories, such as sales by region.
- Scatter plots reveal relationships and correlations, for instance, employee tenure versus productivity.
- Heatmaps highlight density or concentration, useful in customer activity analysis.
Misaligned visuals can mislead or confuse, which hurts rather than helps decision-making.
Simplify Without Losing Meaning
Clarity is king. Charts should eliminate clutter—avoid excessive gridlines, colors, or data points that detract from core insights. Edward Tufte, known as the father of data visualization, advocates for “data-ink ratio,” emphasizing the need to maximize the ink representing data while minimizing unnecessary decoration.
Tell a Story Through Design
Data without context is directionless. A visualization should guide the viewer — highlight key points, use annotations to explain dips or spikes, and sequence visuals logically. Applying narrative techniques creates compelling visual stories that people remember and trust.
Tools and Technologies to Bring Data to Life
The modern business ecosystem offers robust visualization tools fit for various expertise levels:
- Tableau: Widely used for interactive dashboards and adopting a drag-and-drop interface suitable for both beginners and data scientists.
- Power BI: Microsoft's solution tightly integrates with Office 365, ideal for real-time business analytics.
- D3.js: For developers seeking custom, web-based visualizations offering granular control.
- Google Data Studio: A free option for integrating Google Analytics and other data sources into easy reports.
Choosing the right tool depends on business size, budget, complexity of data, and the audience.
Impact-Driven Visualizations: Best Practices
Start With Your Audience
Understanding who will consume the visualization shapes its content and design. Senior leadership may prefer high-level views focusing on KPIs, while analysts need detailed, interactive datasets.
Integrate Multiple Data Sources
Business problems are rarely siloed. Combining financial metrics with customer behavior or market data provides a 360-degree perspective, creating deeper insights and better decisions.
Incorporate Feedback Loops
Effective visualizations are iterative. Soliciting feedback from end-users uncovers pain points, clarification needs, or capability enhancements, ensuring visuals remain relevant and actionable.
Embrace Interactivity
Dashboards with filters, drill-downs, or hover-over descriptions empower users to explore data at their own pace, fostering engagement and ownership.
Case Study: Walmart’s Supply Chain Optimization
Walmart, one of the largest retailers globally, uses data visualization to streamline its complex supply chain involving millions of SKUs and thousands of suppliers. By layering geospatial data with inventory levels and delivery schedules on interactive maps, the operations team identified bottlenecks and forecasted stock-outs before they occurred.
This proactive approach, powered by artful visualization of massive datasets, resulted in improved inventory turnover rates and reduced logistics costs, ultimately boosting profitability.
Conclusion: Transform Your Business With Visual Data Artistry
Mastering the craft of visualizing statistics is no longer optional for competitive businesses—it’s a strategic necessity. When done thoughtfully, data visualization turns raw statistics into powerful stories that inform, persuade, and motivate.
Businesses that leverage clarity, design principles, and tailored tools unlock hidden insights, foster collaboration, and make data-driven decisions with confidence. As you progress from raw numbers toward visual art, you not only elevate the comprehension but also the impact of your business intelligence.
Start viewing your data not just as numbers but as a canvas—where statistics become vivid artwork that drives your business vision forward.
Ready to elevate your data storytelling? Explore modern tools like Tableau or Power BI, experiment with new chart types, and always center your audience’s needs. The journey from data to art awaits you.
Rate the Post
User Reviews


Popular Posts


