How Visual Learners Can Excel in a Textbook World
16 min read Empowering visual learners to thrive using effective strategies for mastering textbook-heavy environments. (0 Reviews)
How Visual Learners Can Excel in a Textbook World
Textbooks dominate formal education—their densely packed chapters, columns of text, and few illustrations can seem daunting, especially to visual learners. Yet, being a visual learner isn’t a disadvantage; it’s an invitation to approach knowledge differently. Here’s how visual thinkers can not just survive, but thrive in environments built around the written word.
Understanding Visual Learning in a Word-Heavy World

Research identifies visual learners as individuals who best acquire new information when they see it. They’re energized by images, diagrams, mind maps, color-coded notes, and spatial organization. According to cognitive psychology, about 65% of people demonstrate visual learning tendencies. But in the traditional education system—often emphasizing long-form reading, note-taking, and essay writing—visual learners may feel out of place.
Consider Sarah, a high schooler who skims through a three-paragraph explanation about the water cycle and feels overwhelmed. As soon as she references a simple diagram, everything clicks. Her brain connects concepts through visual relationships, not linear text. This scenario isn’t rare—it describes millions of students worldwide.
The good news? When visual learners adapt their study strategies and educators acknowledge diverse learning styles, textbook-heavy environments become more navigable. Neuroscience even suggests combining visual stimuli with verbal information enhances memory and retention.[^1]
[^1]: Mayer, Richard E. Multimedia Learning. Cambridge University Press, 2021.
Turning Dense Text into Visual Gold

Instead of passively absorbing blocks of text, visual learners can proactively convert written content into engaging imagery:
1. Create Mind Maps and Concept Diagrams
Mind mapping allows readers to transform outlines, key concepts, and relationships into branched, interconnected diagrams. For example, transforming a five-page history summary into a single page filled with color-coded branches—each representing a different cause of a historical event—can help reinforce understanding and quick recall.
Tip: Digital tools like XMind, MindMeister, or even a blank piece of paper work for building mind maps. Use doodles, symbols, or colors to differentiate information layers.
2. Develop Timelines and Flowcharts
Chronological content, such as the development of classical music or the sequence of mitosis, can be broken into timelines or step-by-step flowcharts. This gives abstract sequences a concrete, visual form. Post-its, index cards, or online apps (like Trello) make timelines modular and interactive.
Real World Example: When medical students studying the nervous system distilled each neurological pathway into annotated flowcharts and color-coded connections, they substantially improved their exam recall, as documented in a 2018 BMJ study.
3. Color-Code, Annotate, and Illustrate
Highlighters and colored pens aren’t just for decoration. Assign a purpose to each color: blue for definitions, green for examples, red for dates. Adding quick sketches or margin doodles can embed meaning and trigger memory. If a biology passage explains plant cells, sketching a labeled diagram with the text makes learning multi-sensory.
Leveraging Technology to Level the Field

Technology has democratized access to visualization tools. Both learners and educators can benefit immensely from new digital platforms:
Visual Note-Taking Apps
"Sketchnoting" apps like GoodNotes, Notability, and Microsoft OneNote encourage users to combine handwriting, type, images, and drawings in a single space. Learners can clip textbook diagrams, paste them into their notes, and annotate over them—melding linear notes with illustrations. This hybrid approach bridges the gap between text-centric learning and visualization.
Case Study: College freshman Kiran used OneNote's drawing tools to color-code organic chemistry mechanisms. Her scores jumped by 30% after she replaced linear notes with color-coded reaction flow charts.
Video-Based Learning Platforms
Platforms like Khan Academy and CrashCourse combine visual aids, animation, and narration to clarify textbook concepts. Watching a short video explainer about quantum mechanics often makes the textual explanations more accessible. Learners should routinely supplement required readings with reputable video explanations for challenging topics.
Collaborative Visualization Tools
Online whiteboards such as Miro and Jamboard encourage groups to brainstorm visually. When preparing for a group presentation or revising dense chapters together, teams can organize ideas spatially, annotate with graphics, and actively connect concepts—increasing engagement and comprehension.
Insight: According to the International Society for Technology in Education, students who engage with content visually are up to 35% more likely to retain core ideas after a two-week interval.
Note Taking: Adapt Classic Methods for Visual Impact

Note-taking need not be tedious copying. Visual learners excel by adapting classic formats:
Cornell Notes with a Visual Twist
The venerable Cornell note-taking method—dividing the page into cues, notes, and summary—can be enhanced by introducing icons, color, and graphic cues. For instance, instead of listing vocabulary in the cues column, include a related sketch or symbol to trigger recall.
Bullet Journaling for Study
Originating as a productivity system, bullet journaling naturally incorporates visual signifiers (dots, dashes, symbols) and encourages creative layouts. Visual learners can organize textbook outlines into modular, easily navigable layouts: calendars with icons for deadlines, color-filled habit trackers, or boxes for key ideas.
Example: A grade 12 student preparing for finals converted her entire World History syllabus into a bullet journal, peppering it with maps, stickers, and hand-drawn timelines. Review time became an engaging visual journey rather than a stressful recap.
Mastering Memory with Visualization Techniques

Visualization isn’t just about making information attractive; it fundamentally strengthens memory. Here’s how visual learners can maximize content memorability:
Build A Memory Palace from Textbook Content
The "memory palace" or method of loci is an ancient mnemonic technique. Visualize a familiar place (like your house), then assign information chunks to specific rooms or locations. For a psychology exam, you might visualize theories of motivation in your bedroom, prominent psychologists in your kitchen, and famous experiments stationed in your living room.
Use Mental Storyboards
Transform abstract concepts into visual stories. To remember steps in a scientific method, imagine a cartoon character conducting an experiment and advancing to each stage—forming a hypothesis, conducting tests, analyzing data—like comic book scenes.
Construct Mnemonic Diagrams
Classic mnemonics like "PEMDAS" can become even more powerful with visuals. For example, draw a literal map or funny image for Every Good Boy Deserves Football (EGBDF for treble clefs). Pairing words with images cements them more firmly in memory, thanks to the “dual coding” effect in the brain.
Active Reading Strategies for Visual Learners

Reading is not a passive activity—even when faced with a solid wall of text. Visual learners can engage with reading on their own terms:
Pre-Reading "Picture Walks"
Before reading, scan chapter headings, review every image or diagram, and look at captions or summaries. This primes your brain to connect new textual details to an existing visual scaffold, making comprehension easier.
Visual Annotation During Reading
Don’t just highlight lines randomly. Label diagrams in the margins, draw connections with arrows, convert chunks of text into flowcharts alongside paragraphs, or jot quick mind maps after finishing each section. Use sticky notes for color-coded commentary, questions, or doodles.
Actionable Practice: After reading a section, close the book and spend five minutes doodling what you remember most vividly. Were the causes of World War I best illustrated as dominoes falling? Did a math explanation look best as a pyramid? This "recall sketch" technique boosts retention and exposes gaps in comprehension.
Breaking Free: Supplementing Textbooks Creatively
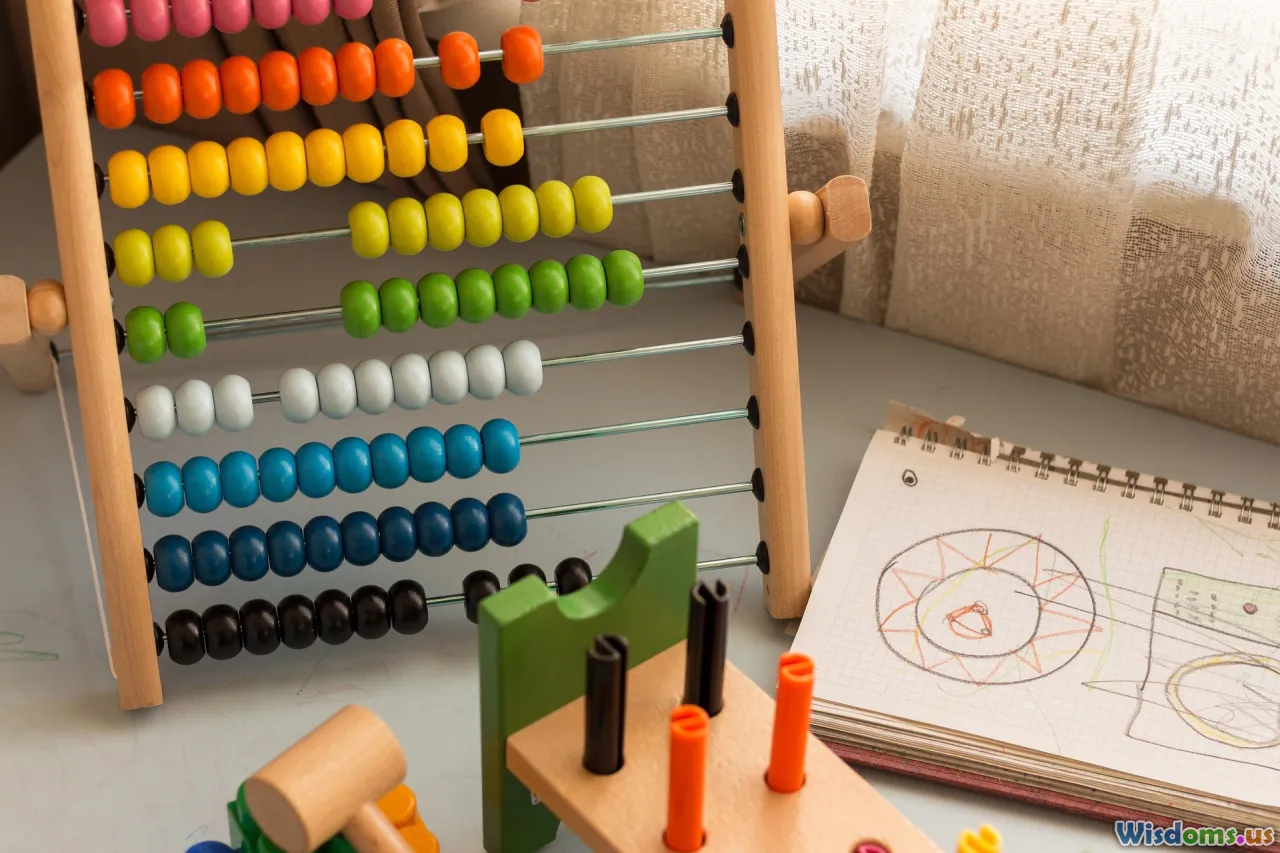
Textbooks may be required, but the learning medium is flexible. Here’s how to add variety:
Custom Flashcards with Sketches
Instead of writing just a term and definition, add quick symbols or thumbnails—drawing an atom for H2O, a sketch of a snake for the Greek god Asclepius (symbolizing healing). Physical or digital options like Quizlet’s image upload enhance this process. Make it a game: match homemade diagrams with concept names.
Interactive Posters and Infographics
Synthesize chapters into a single poster or digital infographic. Platforms like Canva or Piktochart help users create polished visual summaries of processes, timelines, or relationships. The act of designing the poster consolidates learning as much as reviewing it.
Gamify It: Board Games for Complex Systems
Board games, such as building a Monopoly-style board for economic terms or a Snakes-and-Ladders layout to review scientific processes, grant tactile and visual engagement—ideal for group study sessions or review days before exams.
Advocacy: Empowering Teachers and Institutions
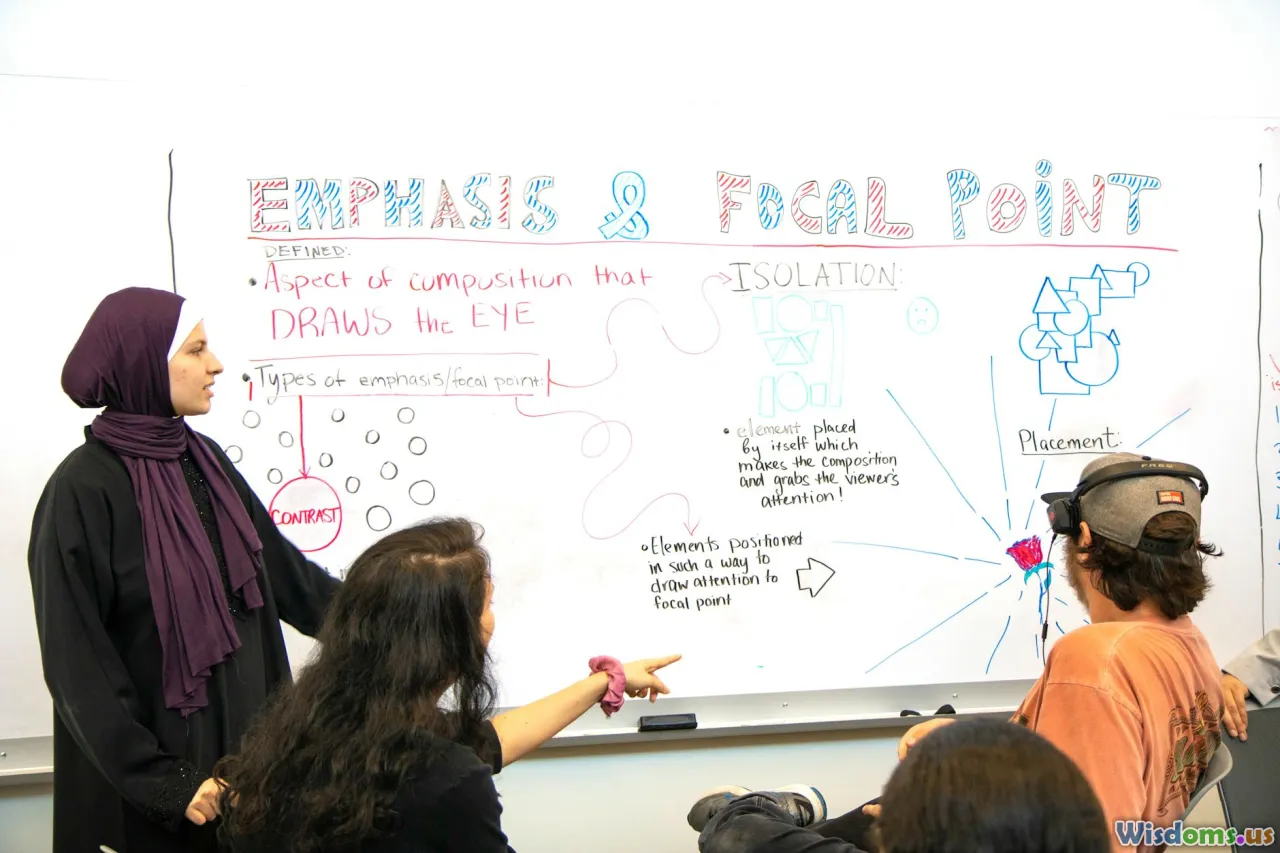
Educational institutions can support visual learners not by abandoning textbooks, but by supplementing them intelligently:
Encourage Multimodal Assignments
Teachers can prompt students to accompany written summaries with mind maps, infographics, or timelines. Science and humanities both benefit from visual project work. For historical analysis, instead of just writing essays, produce a timeline poster. In science, model molecular structures with 3D graphics.
Example: A middle school language arts class at Edison Middle required students to illustrate weekly vocabulary as comics, resulting in 24% better word retention and higher engagement. These assignments became part of the classroom wall, spurring peer discussions and curiosity.
Train Teachers in Visualization Techniques
Professional development can focus on universal design for learning (UDL), equipping teachers with methods for presenting and allowing output through both words and visuals. When textbooks present a dense text, a teacher can model making a concept map or start class by breaking down the information visually, encouraging students to do the same.
Navigating Exams and Assessments

Exams often prize textual answers, but visual learners can use pre-exam and in-exam strategies to their advantage:
Mind Mapping Essays
Before writing, sketch a plan. Place the essay topic in the center, surround it with bubbles for each paragraph topic, key evidence, and counterpoints. This method untangles thoughts and fosters a logical, visually memorized structure.
Visual Memory Cues in Multiple Choice
Imagine or sketch diagrams beside each question—on scratch paper if allowed—especially for complex ideas that involve steps, classification, or spatial organization (like anatomy or math processes).
Case Study: In a study by the University of North Carolina, students who spent one extra minute sketching an answer plan (for both essays and multi-step questions) showed a 17% improvement in problem-solving speed.
After the Test: Reflect Visually
Once results are back, annotate returned exams with stickers for correct answers and icons for mistakes (a lightbulb for new insights, an exclamation mark for common slip-ups). Reviewing errors visually makes future learning more targeted and less discouraging.
Building Life-Long Skills as a Visual Learner

Succeeding as a visual learner isn’t about sidestepping textbooks—it’s about transforming them from enemies to allies. Every textbook chapter can become a visual adventure when approached with curiosity, creativity, and confidence. Organizations of all scales—from school classrooms to university lecture halls—are recognizing the strengths visual learners bring: big-picture thinking, pattern recognition, creative synthesis, and memorable presentations.
By cultivating systems that play to their strengths, visual learners can move beyond coping to mastery—not just acing exams, but developing tools for life-long joy in learning.
Rate the Post
User Reviews
Other posts in Learning Styles & Approaches
Popular Posts
