
The Hidden Power of Data Visualization Techniques in Retail Sales
15 min read Discover how advanced data visualization techniques are transforming retail sales decision-making with actionable insights. (0 Reviews)
The Hidden Power of Data Visualization Techniques in Retail Sales
Retail is awash with numbers, trends, and shifting consumer behavior. For modern retailers, finding clarity among the noise no longer means poring over spreadsheets and basic bar charts. Today, the art and science of data visualization unlocks strategic insights, reveals hidden patterns, and can even shape the path of in-store and online sales. Let’s explore how advanced data visualization is subtly transforming retail—and how you can harness its hidden potential to get ahead.
Revealing Connections in Complex Retail Data
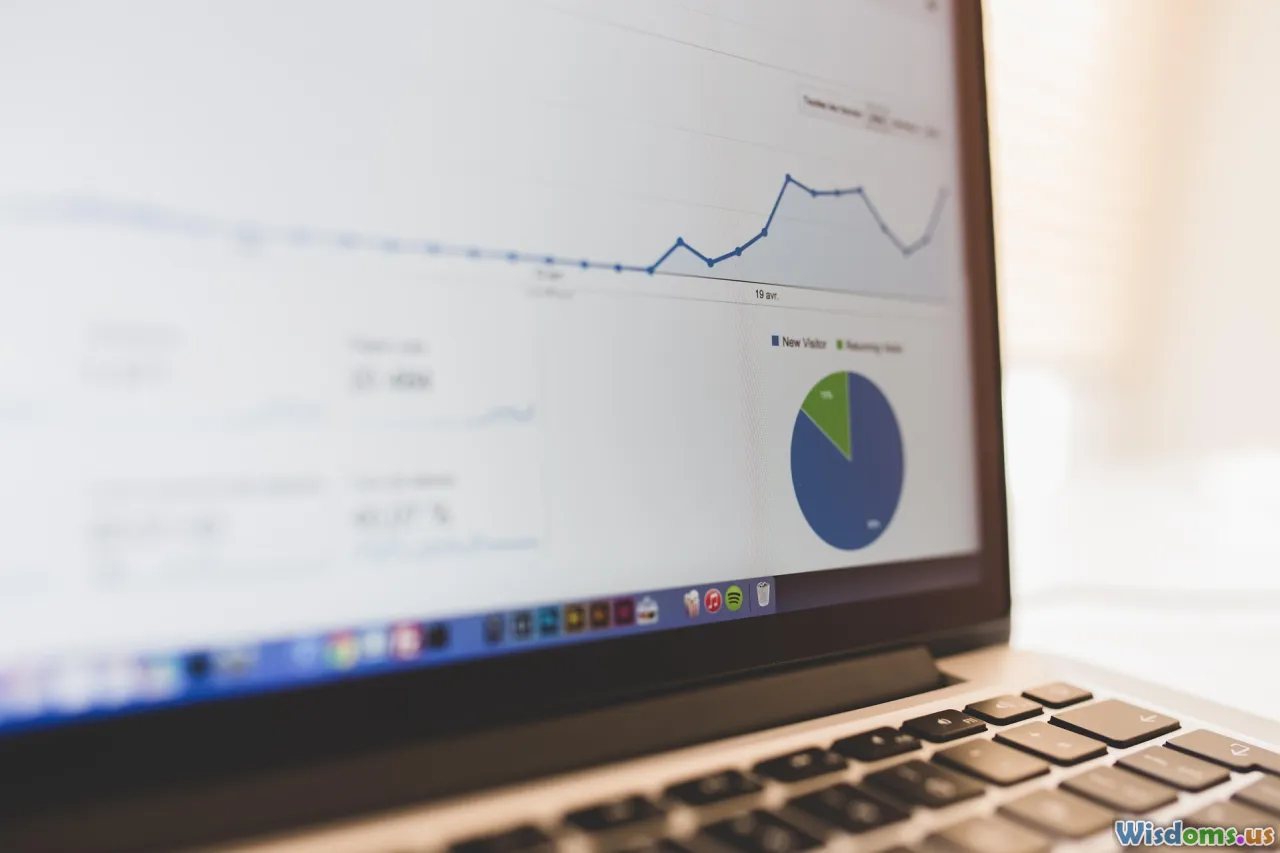
Raw retail data is often vast, unstructured, and multidimensional: sales figures across hundreds of stores, minute-by-minute footfall, product affinities, online and offline conversion metrics—all entwined. Data visualization transforms these sprawling datasets into accessible insights.
For example, interactive heatmaps indicate not just what sells, but where. Retailers like Best Buy employ heatmaps overlaid on store plans to observe customer navigation routes, identifying high-traffic zones for premium product placement and dead spaces needing attention. Gone are static reports replaced by real-time, color-coded feedback loops. Similarly, a supermarket chain may use bubble charts mapping product categories, inventory volumes, and profit margins at once, instantly highlighting high-contribution, low-inventory SKUs—a clear sign to restock or run promotions.
Advanced dashboards now aggregate diverse sources—POS systems, loyalty apps, social sentiment—giving retail managers a true 360° view. These dashboards aren't just visual; they are interactive: filter by season, region, or demographic to unlock localized strategies. Walmart’s analytics team, for instance, leverages custom dashboards to monitor pricing, stock, and competitor activity simultaneously, empowering rapid, data-driven decisions that would be daunting through traditional tabulation.
Enhancing Inventory and Supply Chain Decisions

Every retail manager fears out-of-stocks and overstock; both erode profits and customer satisfaction. Data visualization has emerged as a potent ally for inventory and supply chain professionals, transforming reactive processes into proactive, profit-focused management.
Consider demand forecasting: Amazon’s algorithms process terabytes of data, but for humans, a well-crafted visualization presents forecast demand curves, seasonality patterns, and recent anomalies at a glance. Animated line and area charts, overlaid with historical promotional spikes and weather events, allow inventory planners to see cyclicality and anticipate exceptions—ensuring warehouses stock up or scale back in line with demand, not just guesswork.
Visual mapping of supply chain disruptions (delays, bottlenecks, shortage zones) can focus management attention where it’s most needed. Grocery chain Lidl, for example, visualizes supplier performance as color-coded timelines, immediately alerting teams of delivery reliability concerns. Inventory aging visualizations—with color changing as time-to-expiry nears—ensure perishable goods aren’t overlooked amidst huge product assortments.
Personalized Marketing through Data Visual Insights
Retail success is increasingly tied to personalized experiences. Segmenting customers, analyzing shopping behavior, and targeting offers are complex endeavors—but data visualizations distill multidimensional marketing data into actionable customer profiles.
A notable example: Sephora’s use of customer journey visualization maps. These charts plot the most common online and in-store paths shoppers take, distinguishing between high-spending repeat customers and occasional browsers. Through path and funnel analysis visualizations, the company doubles down on creating seamless omnichannel experiences, fine-tuning loyalty rewards and targeting push notifications.
Venn diagrams and chord charts are effective for visualizing overlapping customer segments, e.g., consumers who buy both organic groceries and sustainable beauty products, helping a retailer design synergistic campaigns. Tableau and Power BI, widely used in retail marketing, now permit campaign managers to instantly build product affinity diagrams: if a spike in wireless headphone sales correlates with smart home device promotions, cross-merchandising is just a click away.
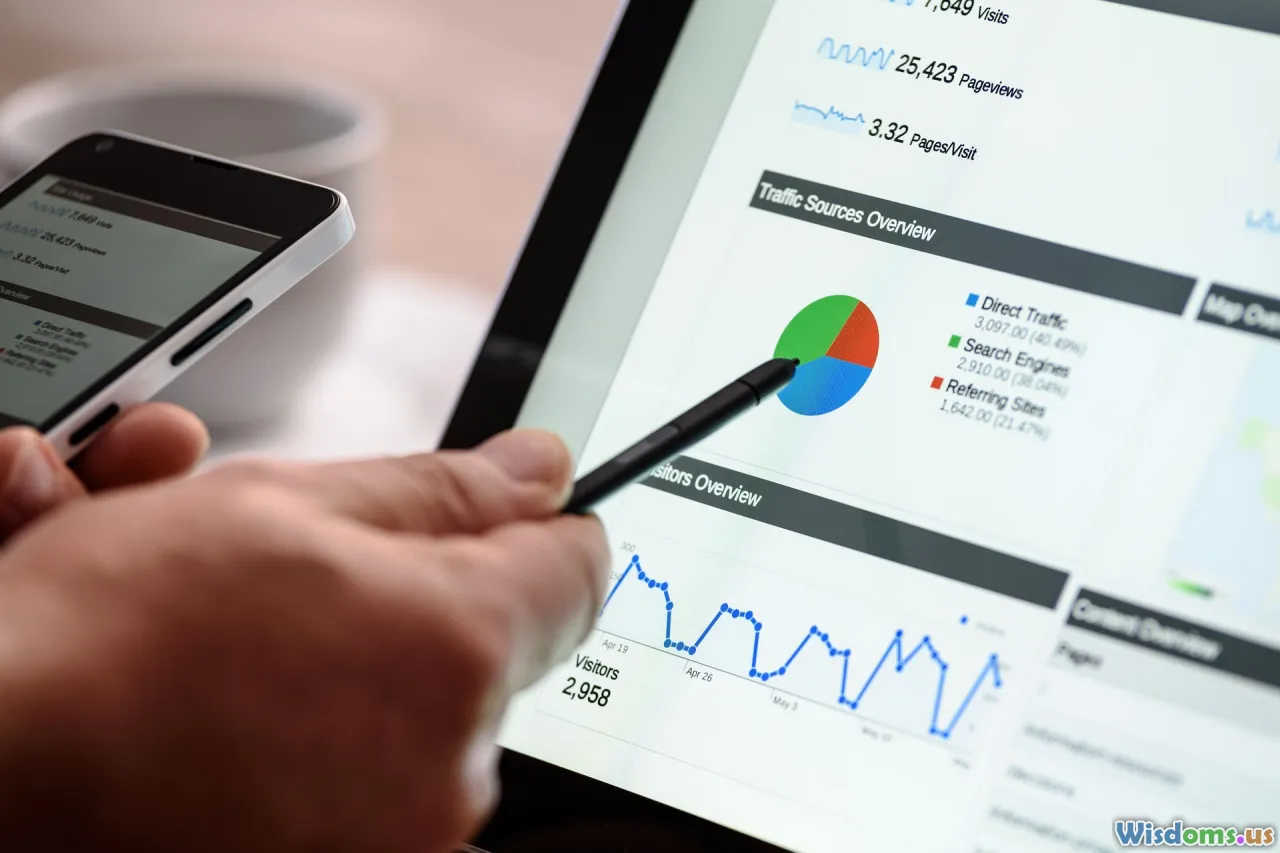
Visualizing Customer Behavior Onsite and Online

Understanding where, when, and how customers engage requires making sense of billions of movements—both in-store and online. Visualization tools help distill this into clear, persuasive storytelling.
Digital retailers, from Amazon to niche Shopify brands, rely on clickstream path analysis and behavior flow diagrams. These not only show how visitors move through an e-commerce site, but where they bounce, what they click, and at what stage baskets are abandoned. The insight: Spotting friction points and underperforming pages is easy when drop-off is spiking in a red zone of a behavior flowchart.
In physical retail, journey mapping is slightly different—and even richer. IKEA leverages motion-tracking heatmaps through their labyrinthine store layouts. These visualizations have led to the now-famous shortcut corridors and redesigned retail paths, improving shopper flow and sales uplift by up to 12% in some stores. When mapped visually, even small layout tweaks or product relocations create instant feedback, leading to continuous improvement.
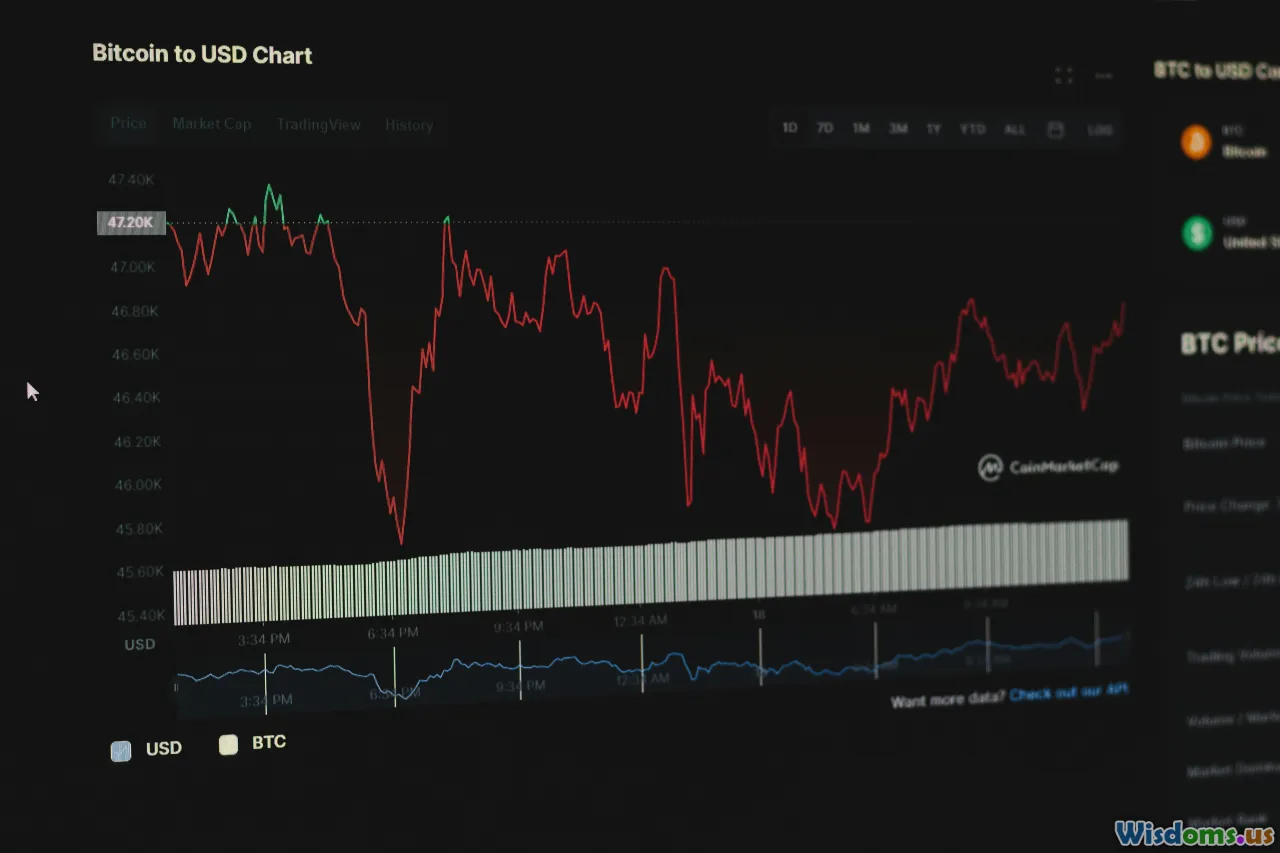
Price Optimization: Seeing the Invisible Competitive Landscape

Retailers know pricing doesn’t happen in a vacuum. Visualization techniques bring crucial transparency to price optimization strategies.
Dynamic line charts and scatter plots help compare your product pricing against competitors, aligning with real-time online data crawlers. A retailer like Target aggregates competitor prices and overlays them with internal sales performance. Against a backdrop of moving average lines and shaded regions denoting promotion windows, analysts can spot price elasticity: for example, if a competitor’s discount triggers a local sales drop, visualization flags it right away for repricing.
Moreover, waterfall charts break down final sale price: starting with the listing price, then visually subtracting coupons, loyalty discounts, and rebates. This transparency helps both executives and floor teams understand true pricing levers.
Interactive dashboards for A/B test results now let pricing managers see at a glance which strategies maximize basket size or reduce refund rates, rather than waiting months for retrospective analysis. Apparel brands like Zara have credited visual analytics for halving time-to-market on popular price points.
Spotting Trends and Seasonality Way Ahead of the Curve
In retail, a delayed reaction can be as costly as no reaction at all. Spotting emerging trends—before they tip into the mainstream—is both art and science, increasingly powered by effective visualizations.
Consider time series graphs that layer historic data with predictive models. Fast fashion chains like H&M integrate real-time social media signals, visualized as spiking lines on dashboards, with in-store demand. If a microtrend in pastel gym wear erupts on TikTok, automated alerts and visually distinct trend bubbles flag it for fast merchandising, gaining vital first-mover advantage.
Seasonality analysis, often portrayed through boxplots or SPC (Statistical Process Control) charts, helps isolate abnormal surges—such as back-to-school, Black Friday, or unexpected viral hits. Visualization of anomalies—like persistent green spikes during a normally-flat period—drives strategic discussions and faster campaign pivots. Beauty retailer Ulta, for example, couples year-over-year area charts with annotation tools, allowing teams to annotate unusual cosmetic launches and plan marketing surges.
Empowering Teams with Storytelling and Collaboration

Charts themselves don’t sell products—engaged, well-informed teams do. The democratizing effect of interactive data visualization empowers even non-technical staff to make smarter, faster decisions.
Consider the power of story-driven dashboards. At North Face, merchandising teams routinely review visualized best-sellers and slow-movers in weekly meetings, using drag-and-drop dashboards co-created with their IT department. These sessions foster cross-team dialogue: store managers, planners, and marketing align on fact-based strategies, using shared visual context rather than abstraction or jargon.
Modern workplace platforms now allow annotating, commenting, and scenario modeling directly on retail visualizations. Why did traffic surge last Saturday compared to the previous month? Teams can pin notes to chart elements, discuss within the interface, and experiment with "what-if" overlays—facilitating rapid, evidence-led iteration.
Investment in data storytelling workshops is increasing in retail. Research by Gartner suggests that retailers who embrace narrative, visual data communication achieve 60% higher success rates with execution of data-driven initiatives compared to those who rely on static reports. Visualization becomes the language that unites, rather than divides, diverse teams.
Overcoming Implementation Challenges

While the payoffs of data visualization in retail are vast, implementation is not frictionless. Data silos, low data literacy, and the overwhelming choice of visualization tools can stall progress.
Brands like Macy’s overcame early hurdles by creating shadow data teams within every department, while investing in ongoing training focused on both basics and advanced visualization types. It’s not unusual for new hires at digitally-savvy retailers to spend more time mastering Tableau or Power BI dashboards than traditional Excel in their onboarding.
Another major success factor: data integration. Unified views—whether in Google Looker, Qlik, or an in-house solution—require ETL pipelines harmonizing POS data, e-commerce metrics, supplier scores, and even social feedback. Only then do the visualizations truly reflect the heartbeat of the business and avoid misleading half-truths.
Finally, resist the allure of complex graphics for their own sake; clarity should trump aesthetics. Well-trained analysts collaborate with managers to find the right granularity: simple bar-graph alerts for cashiers; multi-layer time series for tactical buyers; Sankey diagrams for strategic CX managers.
Actionable Tips for Elevating Retail Data Visualization

Ready to breathe new life into your own retail data strategies? Consider these actionable best practices:
- Start Simple, Scale Smart: Launch with a few key metrics—sales by region, inventory levels, basket size—then expand to advanced analytics as comfort grows.
- Get Cross-Functional Buy-In: Showcase visual case studies (before-and-after dashboards) to secure support from merchandising, IT, and frontline teams.
- Prioritize Interactivity: Choose tools and dashboards that allow live filtering, drill-downs, and customizable views to suit different audiences and rapidly changing scenarios.
- Optimize for Mobile: Ensure field teams can access and interact with key visualizations on smartphones and tablets—even during store walks.
- Review Regularly: Use recurring review sessions to iterate: archive ineffective dashboards, and respond to staff feedback. Visualization is a living process, not a one-off design.
- Foster a Visualization Culture: Cultivate a company culture that values curiosity, experimentation, and story-driven decision-making, underpinned by accessible, easy-to-learn visualization tools.
The retailers who thrive in the next decade will not be those who have the most data, but those who transform that data into clear, actionable visuals that inspire timely decisions at every level. Unlock the hidden power of data visualization in your retail journey, and the numbers will soon tell their story.
Rate the Post
User Reviews


Popular Posts


